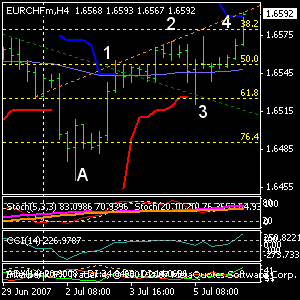
July 6 (6:45 EST)- The Green line is the same trendline I drew on my (4h chart) post last July 3. I said breached of that line means continuation of the up move, This is the number 1 on the chart above.
On my post right before this one. I said "EUR/CHF pair broke the upside trendline, but indicators are showing overbought. Might have to wait for a dip to get in". This is the number 2 on the chart.
On number 3, the dip stopped at the same exact trendline with confluence of lower ATR and 61.8 fib level. Then make a reverse to the number 4, which lays the confluence of the new "mid term" trendline and upper ATR. Indicators also showing overbought, so price might bounce there.
If you draw a trendline from "A" to "3". This might be the next stop before resume of the uptrend. Take note that the price just reach higher than the previous highs. This is a good indication of long term bull bias.
Just my observation. Trade it at your own risk.
7.6
Posted by
HARWIN
at
6:30 PM
![]()
Subscribe to:
Post Comments (Atom)


0 comments:
Post a Comment