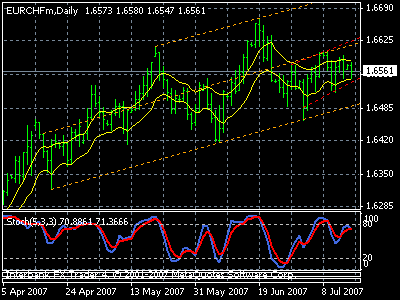
"Forex trading could be your key to financial freedom if you could consistently earn pips and at the same time realising the power of compounding".- Harwin Poon


Google

Yen Falls as Risk Aversion Pauses on U.S. Stock Rise

Source: CNBC

The yen fell on Tuesday as a rise in U.S. stocks eased fears about deteriorating credit markets, helping to halt risk aversion that had led to the unwinding of carry trades and supported the Japanese currency.

Concerns about ongoing U.S. subprime mortgage market woes spreading to wider credit markets have prompted investors to cut risk exposure and close out carry trades in which they had borrowed in low-yielding currencies such as the yen to buy higher-yielding assets.

Moves in the U.S. stock market and developments in credit markets will continue to dictate market direction, with traders saying that the dollar's reprieve may prove to be short-lived if
U.S. stocks resume their slide later in the session.

The Dow Jones Industrial Average rose 0.7% on Monday, after falling 1.5% on Friday.

"The rebound in U.S. shares on Monday was not very strong, and if the Dow fails to rise today or wipes out all of Monday's gains, then the dollar could fall towards 118 yen and the euro
towards 161 yen," said a dealer at a Japanese bank.

Traders said that during the Tokyo session on Tuesday, month-end demand for dollars from Japanese importers was likely to support the dollar and the euro against the yen.

As traders kept their eyes on developments in the credit markets, a move by hedge fund Citadel Investment Group could help calm concerns about a credit crunch. Citadel said on Monday it took over Sowood Capital's credit portfolio after Sowood suffered heavy losses from bond trades.

The move showed that liquidity is still available, with some buyers ready to snap up beaten-down portfolios.

Market reaction was muted to Japanese employment data, which showed that jobless rate fell to a nine-year low of 3.7% in June.

A raft of key U.S. data is due out later in the session, including personal income and the core personal consumption expenditure (PCE) price index, a closely watched inflation gauge.

Whatever Happened to Risk?

Source: forexfactory
Author: Danske Bank

US subprime mortgage woes have long been casting a shadow over the financial markets. Until recently, however, there had not been much fallout on financial markets in general - the problem was considered as limited to the US housing market. But perceptions changed in the course of the past week as subprime fears spread to other risk assets, and the past few days have seen pretty much all risk assets feel the heat - global equity markets have fallen, high yielding and Emerging Market currencies have come under pressure and credit spreads have widened.

In other words, there has been a broad-based fall in global risk willingness. There have been a couple of instances of this earlier this year, but this time it looks stronger and more broadly based - reviving memories of May-June last year.

But what is the cause and when will the current bout of jitters end? There can be no doubt that risk appetite has been high in the global financial markets. So in a way a correction is natural - with the catalyst being subprime woes this time around.

But how long will the correction last - this is the big question. While the global economy is generally sound, we would definitely urge caution, as it is likely that the correction may continue for some time yet (see “Fixed Income”). That said, with the global economy in a healthy state, a long-lasting general downturn in the financial markets is probably not on the cards.

xxxxxxxxxxxxxxxxxxxxxxxxxxxxxxxxxxxxxxxxxxxxxxxxxxxxxxxxxx

I had 2 consecutive false analysis made last week, which in a drawdown right now. The carrys recover a bit during the Tokyo session today, but continues downtrend is still expected. We won't see must clarity 'til wednesday and thursday important news announcement. With BOE and ECB expected to hold rate hike this thursday, swap earnings from carrys will tighten and will be less attractive for investors. We need to hear how they deliver their announcements.

July 31 (2am EST)- I just opened a short hedge at around 1.6490 (EUR/CHF) on Volker account (Our new manage portfolio). Price just bounce off the round number 1.6500 with confluence of minor trendline, 38.2 fib and 72EMA.

While on PMTFC and TN accounts, I'll put them on hold for a while. The margin used are too tight to handle another false move. The floating loss need to recover some more before I enter again.

7.27 EUR/CHF

Photo Sharing and Video Hosting at Photobucket

Daily chart:
- Price touch the lower channel. Might bounce from there or a full reversal.

Photo Sharing and Video Hosting at Photobucket

4h chart:
- Stoch crossed up.
- CCI about to cross, not confirm yet.
- RSI hovering around 30 level.
- Outside the Bollinger Band.

Photo Sharing and Video Hosting at Photobucket

1h chart:
- Stoch & CCI just crossed up at the same time.
- ADX shows bear losing momentum.
- Bull engulfing candle/bar formed.

We can scalp a little from here or a probable a full reversal. There are lots of resistance lines above, so be careful. Pay attention to 38.2 and 50 fibs of 1h chart.

I'm not taking this trade. I still have 3 sets of long hedge opened on a drawdown. Carrys unwinding, I better stay on the sideline for now.

Carrys unwind pose hedge correlated pairs concerns

Here are a few articles that will explains the drop earlier.

Source: forexfactory.com
By: Thomson Financial

Yen finds fresh legs as risk aversion spreads

LONDON (Thomson Financial) - The yen continued to benefit from a fresh bout of risk aversion in global markets, leading to some unwinding in the carry trade phenomenon which has been plaguing the Japanese currency.

Carry trades are funded in currencies with low yields such as the yen and moved elsewhere where yields are higher such as the Kiwi and Aussie dollars as well as the pound.

'Unwinding of carry trades is hitting the markets rather than the broad dollar-selling as the yen rallies across the board on emerging credit concerns in global credit markets,' said Ashraf Laidi at CMC Markets.

Laidi said today's move was a 'manifestation of a sharp reduction in global risk appetite emerging from worldwide concerns with hedge fund losses.'

To some extent economic data from outside Japan helped the process today. In the UK, where interest rates are at 5.75 pct and heading higher, home price growth stalled in June while in New Zealand, where rates are above 8 pct, the central bank signalled that borrowing costs may not have higher to go.

Also signalling the drop in risk appetite, equity markets were lower with the benchmark FTSE index in London and the DJIA index in New York both slumping over 200 points.

Weak data out of the US also added to the ramping-up in risk aversion, with the dollar also coming under pressure.

In particular, weak new homes data have helped to compound ongoing concerns about the sub-prime mortgage market in the world's largest economy, adding to the risk-averse sentiment in favour of bonds.

Sales of new homes in the US fell sharply for the second straight month to 6.6 pct in June, a level just a touch higher than a seven-and-a-half year low, to a seasonally adjusted annual rate of 834,000 units. Economists had expected a 905,000 unit rate.

'The new and existing home sales reports (released yesterday) are a clear wake-up call that the housing downturn still has a long way to go,' said Paul Ashworth, senior US economist at Capital Economics.

Durable goods orders data from the US also rose at a slower-than-expected pace in June, by 1.4 pct after falling a revised 2.3 pct in May. Economists had predicted a 2.0 pct.


Here's another one by NewstraderFX

Carry Trades Unwind as Bonds Are Bought and Equities Sell

Gobal yeilds are down across the board, as traders concerned about further subprime problems close out their risky positions. Yeild on the US 10y has lost 6 basis points so far today in early trading.

S&P Futures on the Sept contract extended their loss to 17 points from 14 points after the durable goods report was released. Core durables showed a decrease of -0,5% vs an expected 0.5% gain. The prior months number was revised to -0.2% from -0.4%.

European equities have had their worst day in over 4 months so far today.

The DOW is off over 200 points as yeild on the bechmark 10y has fallen to 5.81%, a clear sign investors are fleeing riskier assests (equities and carry trades). All ten of the S&P groups are down.

If things really start to go bad-they might pull the plug so we'll se what happens.

GBP/JPY is down nearly 400 pips on the day.

The DOW is off nearly 300 points so far on the day and yeild on the 10Y has gone to the lowest levels seen since May-below 4.8%.

It's likely that if US equities finish towards their lows for the day-Asian equities will follow suit and further unwinding of carry trade positions will occur.


And to borrow some quotes at Bloomberg:

Global Stocks Drop; Investors Shun Risk as Credit Woes Worsen


July 26 (Bloomberg) -- Stocks tumbled around the world and U.S. Treasuries rallied on concern higher borrowing costs will slow takeovers, spur debt defaults and curb earnings, prompting investors to flee riskier assets.

...The yen rose against all 16 of the most actively traded currencies as traders bought back yen used to finance investments outside Japan.


And from CNBC headliner:

Selloff in Stocks Picks Up Steam; Dow Sinks As Much as 440

Stocks plunged further after disappointing news from the housing industry prompted heightened concerns about credit markets and the U.S. economy. "We don't know how bad this will be," said David Kotok, chief investment officer at Cumberland Advisors. "We do know that it's bad and it's accelerating to the downside."


EUR/CHF dropping more than 120pips on a single day is very unusual, there is definite abnormality that is going on in the market. Not even expert financial analyst can predict how far down those carrys can go. I'll make some sacrifice loss tomorrow if I had to.

7.25 Trade Recap

Photo Sharing and Video Hosting at Photobucket

Though it went up a little, but not enough to make a profit. Followed by a steep drop. My trade now is in a drawdown.

I'll explain why it drop... later, ...not in a good mood.

7.25 EUR/CHF

Photo Sharing and Video Hosting at Photobucket

Another good entry?

- Stoch & CCI about to curve up. Not confirmed yet.
- Price nearly touch 76.4 fib, probably will.
- 4h chart retrace from a trendline.

If price went up from there. Exit point should be at around 1.6680-90 for me.

We'll see.... I might be wrong this time.

GBP/CHF 2:40hrs after

Photo Sharing and Video Hosting at Photobucket

1:03pm EST- I just closed the hedge positions I taken earlier, just right after GBP/CHF price nearly touch the blue ATR and the trendline.

Another record high for PMTFC account since cycle2 started. And speaking of record high... EUR/CHF has reached its record high of the year.

7.24 GBP/CHF analysis

Photo Sharing and Video Hosting at Photobucket

GBP/CHF (10am EST) 1h chart:
hmmm... seems like a good entry there.
- Low ATR at 38.2 fib.
- Pin bar formed 3rd bar from right.
- Stoch & CCI crossed up.
- Downtrend volume decreases.

Target at previous high (2.4890) or the upper trendline or the blue ATR. We'll see...

Take note: This is GBP/CHF; not EUR/CHF.

7.23 Monday

EUR/CHF 4hr chart
Photo Sharing and Video Hosting at Photobucket

Remembered what I said last July 12?

I said, "If price bounce off the lower channel on 4hr chart, I'll go for a long hedge (depende on indicators), Then from there... I'll open a long hedge positions with TP on the upper channel". Thats what I did, when the Stoch and CCI crossed above their oversold lines (see the 1hr chart below). But I didn't wait for the price to reach the upper channel to close the long hedge positions, I close it too early. Because price start to lose stream. second, the Stoch & CCI starts to curve down. Third, the average daily range of EUR/CHF is only 40-50pips, and price already rallied 65pips from 1.6586 to 1.6651. So I decided to bag the profit of the day.

I hope all of you have applied the lesson about channels I post during the weekend.

Photo Sharing and Video Hosting at Photobucket

I wasn't expecting such a high volatility from EUR/CHF on a monday. Specially when there was only one economic news release today, the ECB Vice President Papademos Speech.

Today's trade is the best single trade ever since we started our PMTFC cycle2. I nearly surpass the whole gain I got last week, and yet we are only on the first day of the week. So I'm expecting a better if not the best week for PMTFC account.

xxxxxxxxxxxxxxxxxxxxxxxxxxxxxxxxxxxxxxxxxxxxxxxxxxxxxxxxxx

5pm EST- EUR/CHF reverse after nearly making a new record high at 1.6664, just 7pips short to this year highest high of 1.6671. It is down trending right now. Levels to watch out for are the 1.6632 and 1.6623, these are the 38.2 and 50 fib of the latest swing of 1.6581 LO to 1.6664 HI. On the 38.2 fib, there lays a confluence of lower ATR and a minor trendline.

xxxxxxxxxxxxxxxxxxxxxxxxxxxxxxxxxxxxxxxxxxxxxxxxxxxxxxxxxx

I like to take this opportunity to thank Lorie for helping me edit the Limited Power Of Attoney (LPOA) forms. I might add another account to manage starting next month. Wish me luck.

Channel Lines Part 2

The channel technique can also be used to spot failures to reach the channel line, signaling the weakening of a trend. As a general rule the failure of any move within an established price channel to reach one side of the channel, usually indicated the trend is shifting and increases the chances that the other side of the channel will be broken. See below how the failure of prices to reach the channel line at point 5 serves as an early warning the trend is turning and increases the odds the trendline will be broken.

Photo Sharing and Video Hosting at Photobucket

A channel can also be used to adjust the basic trendline. Below, note when the channel line is broken with point 5, our trader drew a new trendline parallel to the new up channel line. With the uptrend accelerating, it stands to reason the basic trendline will accelerate as well.

Photo Sharing and Video Hosting at Photobucket

When prices fail to reach the channel line, as seen below, a down trendline can be drawn between points 3 and 5, and tentative channel line can be drawn parallel from point 4 to show where initial support can be seen.

Photo Sharing and Video Hosting at Photobucket

The measuring implications of the channel line state once a breakout occurs from the existing price channel, prices usually travel a distance equal to the width of the channel. So the trader simply measures the width of the channel and projects the amount from the point at which either trendline is broken. Even though the channel line works often enough to be a very useful tool, remember, it's the basic trendline that is most important.

Channel Lines Part 1

One of my blog followers ask me which weighted the most when deciding which directions to go. My answer would be channel lines, followed by Fibonacci levels, then confirm it with the Stoch and CCI indicators. The 72EMA and Daily ATR are just stoppers, price don't "always" bounce there but they "usually" do. And the not so important tools in my arsenal are the RSI, ADX and Bollinger Band. The RSI and BB shows overbought/oversold of a currency pairs just like what Stochastic Ocillator do. The ADX can be replace with volume and momentum indicators.

When hedging correlated currency pairs using carrys chart as a gauge, combining the tools mentioned above with Freedomrocks software or the True North Concepts Hedge Calculator can be a very safe and profitable technique. But remember to use less margin when going against a trend, or if possible... don't counter trade.

We will discuss about channel lines today. How to plot them, how useful can it be.

A channel line, or as it as sometimes called, return line, is a variation of the trendline technique. Occasionally, prices will trend between two parallel lines, the trendline and the channel line. This event can be used to a profitable advantage once the trader recognizes that a channel exists.

Photo Sharing and Video Hosting at Photobucket

Looking at the uptrend above, a channel line can be drawn at the first prominent peak (point 2). If the prices dip back down to the trendline at point 3, rallys back up to the channel line at point 4, and dips back to the trendline at point 5, then a channel does exist. The same is true for the downtrend below, except for the dips and rallies being reversed in a down direction.

Do you see the value here? All treaders, where day trading, swing or options trading can use the basic up trendline to initiate new long positions, and the channel line provides points for taking short term gains. just like the basic trendline, the more times a channel is successfully tested and remains intact, the more important and reliable it is. The more aggressive trader may initiate a countertrend short position here, but keep in mind trading in the opposite direction of the prevailing trend is a dangerous and costly tactic if it fails.

Whereas the breaking of a trendline indicates a probable trend change, the breaking of the rising channel line has the opposite meaning. It signals the acceleration of the existing trend. Here some traders see the breaking point of the cahnnel line in an uptrend as the opportunity to add long positions.

5 to 5

Photo Sharing and Video Hosting at Photobucket

Same chart as my last post, EUR/CHF 4h zoom out to get a clear view of the channel.

July 20- Right after the market cut-off time (5pm EST), I predict that EUR/CHF is already at its tipping point. And yes indeed, after 3 attemps of crossing the upside, price exhausted and made a sharp drop exactly to the lower channel. And bounce up and down from there 'til the market close of the week (5pm EST).

On 4h chart. The lower channel is also where in confluence with the middle BB (bollinger band), the middle bb which most of the traders ignore is where price usually make a bounce. It is also a few pips near 38.2 fib of a previous major swing.

On 1h chart. It touch the 72EMA and lower ATR, supported by Stoch and CCI indicators curved up from oversold zone.

On monday, I don't know yet where it will go. Probably will make a small retrace up before heading down. If the lower channel or 38.2 fib is breached, the first target is 1.6550 and follow by the round number 1.6500. On the other hand, if it make a full reverse pass the middle channel again, the upper channel will be the TP. Let the indicators guide you.

Another great week for PMTFC and TN account. Happy weekend everyone.

Sell Oppotunity Arise

Photo Sharing and Video Hosting at Photobucket

The EUR/CHF rally stopped out after hitting the previous middle channel, just right after the market cut-off time. Probably liquidation of profits...

Price is way above the Bollinger Band (BB). 3 indicators are on overbought (OB) zone, 1h chart indicators already crossed. And it is at 74.6 fib of a previous major swing (1.6670 HI to 1.6462 LO).

Might be a good time to place a short hedge. I might be wrong. All care taken but take no liabilities. Trade it at your own risk.

Closed after 63 pips...

July 20 (1pm EST) I just closed the GU UC hedge after GBP/CHF rallied 63 pips to the upside. A two and a half hours trade.

Another good week for PMTFC and TN account. No trades on PMTFC at this moment, while TN has 1 set on a drawdown.

Hedge Cable against Swissy

Photo Sharing and Video Hosting at Photobucket

July 19 (10:20am EST) GBP/CHF 1h chart

- Price hit a major trendline and bounce.
- Also hit 72EMA.
- 38.2 fib of previous swing; 76.4 fib of previous bigger swing.
- Stoch and CCI crossed above their significant lines.
- ADX shows losing bear volume and momentum slowing down.

should we place hedge long GBP/USD against USD/CHF? I'll give it a shot.

EUR/CHF- As I have said yesterday. There might still room for the upside, and indeed it went up today. I already closed my long hedge and wait for a dip to enter again.

Carry Trade Restrain from Bear Stearns Woes

Source: Bloomberg
By: Agnes Lovasz and David McIntyre

July 18 (Bloomberg) -- The yen rose as losses on Bear Stearns Cos. hedge funds prompted investors to reduce purchases of financial assets funded by borrowing in Japan.

The Japanese yen advanced against 15 of the 16 most-actively traded currencies as investors scaled back so-called carry trades. The dollar touched a record low against the euro earlier after Bear Stearns told investors in two of its hedge funds they will get little if any money back after losses related to U.S. subprime mortgages.

``Risk appetite is starting to pull back and the potential is that it starts to hurt the carry trade,'' said Ian Stannard, a currency strategist at BNP Paribas SA in London. ``That's positive for the yen.''

Against the dollar, the yen climbed to 122.13 as of 7:19 a.m. New York, from 122.34 late yesterday. It also gained versus the euro, to 168.35 from 168.59. The dollar declined to an all- time low of $1.3833 per euro from $1.3781 in New York yesterday, and last traded at $1.3785.

The yen recovered from a 21-year low versus the New Zealand dollar to trade at 96.58 from 96.63. It rebounded from a 15-year trough against the pound to 250.28 from 250.40 late yesterday.

Investors have favored New Zealand and the U.K. for carry trades because the two countries have interest rates as much as 7.5 percentage points higher than Japan's 0.5 percent rate, the lowest among industrialized countries.

Dollar Declines

The dollar fell to a 26-year low of $2.0548 per pound and weakened to 87.85 cents against the Australian dollar, the lowest since February 1989.

Defaults on loans by homeowners with poor credit histories have deepened a housing market slump that threatens to curb U.S. economic growth. Data later today will show U.S. builders broke ground at an annual pace of 1.45 million new homes last month, down from a 1.474 million rate in May, a Bloomberg survey showed.

Financial industry losses caused by subprime mortgage defaults and the housing slowdown may be addressed by Federal Reserve Chairman Ben S. Bernanke at his two-day semi-annual testimony to Congress starting at 10 a.m. in Washington

A Fed trade-weighted index measuring the dollar's foreign- exchange value fell this week to the lowest since its inception in 1971. The U.S. Trade Weighted Major Currency Index, measuring the currency's performance versus seven currencies, fell to a record low of 77.24 on July 16 and was at 77.29 yesterday.

``Breaking through those levels marks a new stage of the weak dollar trend,'' said Koji Fukaya, senior currency strategist in Tokyo at Deutsche Securities. ``The dollar's depreciation may accelerate.''

Euro May Stall

The euro's gains against the dollar may stall, according to charts traders use to predict future price movements.

The 14-day relative strength index against the dollar was 75.19 today. The index has been above 70, a level which signals the currency is overbought and may be due for a reversal, for a seventh session.

The common European currency faces resistance at $1.3816 and $1.3886, where sell orders are clustered, said Sundararajan Srinivasa, a technical analyst at Lehman Brothers Holdings Inc. in London, in a note to clients.

Any yen gains may be limited by speculation the Bank of Japan will delay raising interest rates while it gauges the impact of subprime loan defaults. The U.S. is Japan's largest export market.

Some BOJ board members said it's necessary to watch the U.S. housing market, according to minutes of the June meeting released today. While some officials said consumer prices excluding fresh food will rise in the long term, others said lower oil prices will exercise ``stronger downward pressure'' on core prices, the minutes showed.

The central bank's board voted unanimously to keep rates unchanged at that meeting. The BOJ decided 8-1 to keep policy on hold on July 12.

``The market has priced in a rate increase in August, but the BOJ may not move until September,'' said Kengo Suzuki, a currency strategist at Shinko Securities Co. in Tokyo.

xxxxxxxxxxxxxxxxxxxxxxxxxxxxxxxxxxxxxxxxxxxxxxxxxxxxxxxx

I'm still waiting on the sideline. Only 1 set of buy hedge opened that is near breakeven. EUR/CHF is at overbought zone on 1h chart, back to the previous lower channel support turned resistance. 4h chart indicators pointing up, might still have some room for the upside before making a correction down. Long term or the daily chart is still bear bias.

If you look closer to EUR/CHF 4h chart, you might see a semi-declining channel forming, and price is at the top channel.

7.16 Monday

July 16 2:45pm EST- Daily and 4hr chart.

Photo Sharing and Video Hosting at Photobucket

Clear channel (orange) and a smaller TF (4hr, red) channel. I'll wait for the price to touch the lower orange channel. If indicators start to curve up from the oversold zone, I'll open EUR/USD and USD/CHF long positions. Target Profit (TP) is the orange upper channel. This will be a long term trade, might take days or a week.

Note: the channel on the daily chart is not the same channel I drawn on the 4h chart.

Photo Sharing and Video Hosting at Photobucket

But on the other hand, if it makes a clear bounce from the 4hr lower channel (which is the red one on the daily chart above), I'll go for a long from there. Target Profit (TP) is the upper channel of the Daily chart. Bollinger band now is squeezing, a breakout is about to happen, whether up or down... is not confirmed yet.

I'm not gonna open sell hedge for now, even if price penetrate the 4h lower channel. The range from current price to the daily lower channel is too tight. Not worth to risk the margin.... unless drop below 1.6500 or the "daily" low channel.

A recap of today's trade:

Last friday (2 post below), I said I opened both sell hedge (1%) and buy hedge (5%) when price is at the middle channel of the 4h chart. Today, price went down and reached the lower channel which is my TP. I closed the sell positions with a few profits, leaving the buy positions in a drawdown. Then price bounce off from the lower channel, back near where we started 'til it loses steam. Since EUR/CHF is a carry trade pair.... there's no reason to panic leaving buy positions opened.

The logic of my friday's trade is,... it is a hedge within a hedge trick. If for instance the price didn't went down today and shoot up. The buy hedge gains will offset the sell hedge loses. But luckly, it went down first and we had the oppotunity to close those sell positions in profit.

The report I'm giving here is only half of whats really going on on my trade portfolio. What I'm actually doing is much more complicated. It is a hedge within a hedge and within a bigger hedge, A triple hedge. I'm not encouraging newbies to trade this way. This kind of methodology needs lots of computation and some basic trading knowledge.

Friday the 13th

Today is Friday the 13th and also the last day of the trading week. For those directional traders who has paraskavedekatriaphobia, their heightened state of anxiety or fear could have save them from the whipsaw that happened to the majors earlier. It has some advatages being superstitious sometimes, it makes you more caution of things that happening around you.

We had 2 economic news announcement earlier. The Retail Sales (8:30am) and the Consumer Sentiment (10:00am). The 8:30 numbers came out way lower than expected and the 10:00 numbers which is the more important one (for inflation gauge) came out far better than expected. This 2 contradict announcement causes the whipsaw. I bet a lot of small players trading the directional ways with tight stoploss got stopped out on that.

This is the reason why I don't trade the news and hedge the market instead. To know more about the tools I'm using. You may contact/email me at harwin21@yahoo.com. I can set you up with my friend (MikeQC) who is an active sales rep for FreedomRocks. He'll walk you through the process and give you a free trial for the FR software.

For the other tool that I'm using. Which is the True North Hedge Calc., You may just click the yellow banner on the sidetab of this page.

EUR/CHF ended the week with only 7pips below the opening price of this week (1.6594). There were lots of buy & sell hedge opportunities on the small range bounce. I had a great trading week, hope you guys aswhile. Happy weekends everyone!

Sleepy Me

EUR/CHF went sideway since the last 8 hours, almost formed a flatline on 1hr chart.
Though it closed above the 38.2 fib (1.6580), I didn't open any buy positions, because the CCI was way way up the overbought zone at that time.

The situation right now on 4hr chart is that the price penetrate above the resistance (middle channel) level, and that level now turns into a support level. Price having a hard time crossing down the middle channel, but indicators still on the OB zone. And I need to hit the sack now.

So here's what I did. I opened a 1% risk short hedge (both sell positions) and a 5% risk long hedge (both buy positions). Since EURCHF is at a consolidating phrase right now... soon it will make a breakout. If it went down, I'll gain some few pips from the drop, while holding a drawdown from the long positions. On the other hand, if it went up, the gains from the long hedge positions will offset the short hedge position's loss.

Dollar Weak on Subprime Concern

The dollar remains under pressure from the deteriorating subprime mortgage market. The euro set a record high at 1.3797 versus the dollar and the sterling hovers around high levels 2.03.

The market was shocked by continuous warnings on the housing sector this week. Large home appliances retailers lowered profit forecasts, and Standard & Poor’s and Moody’s may downgrade credit rating of over $17 billion debt backed mostly by subprime mortgage. According to Bloomberg, mortgage foreclosures rose 56% year on year to 926k in the first half of this year, in June the rise is a scary 87%. This underlines the fact that the US housing market is melting down and the impact may spread into the broader economy.

The Bank of Japan left interest rates at 0.50% as expected last night. The report showed board members voted 8-1 to keep the rates unchanged, a signal that August may still be too early for the central bank to raise rates. The yen remains under pressure from carry trades.


Source: forexnews.com
Author: Yan Xu

7.12 EUR/CHF analysis

Photo Sharing and Video Hosting at Photobucket

5:30am EST- EUR/CHF 4hr chart:
Ascending channel formed. Price right now is in the middle of the channel, Price usually bounce from this middles. Both indicators showing overbought.

Photo Sharing and Video Hosting at Photobucket

On 1hr chart. Price is in a ranging mode, going up and down in between 1.6560 to 1.6580. Both Stoch and CCI are near overbought area, ADX shows low momentum.

Here's what I'll do. Place a horizontal lines at 38.2 fibo (1.6580) and 50 fibo (1.6550). The 2 lines will be my resistance & support levels for now. Break of the upper line, I'll open both long positions with 3% or 5% risk on EUR/USD and USD/CHF, by using Freedomrocks software (for PMTFC acct) and True North Calc (for TN acct) to compute the proper lot size to allocate for the hedge trade. First TP (target) is the 23.6 fibo on 4hr chart, I will close both long positions on the touch of 1,6612 level and 2nd TP is on the 4hr upper channel.

If price breaks the 50 fibo level down, I might open both short positions with only 1% (dependes on what indicators are showing when it reach that level), using also the same instruments mentioned above to calculate the lot size to hedge. TP will be the round number 1.6500 or lower, depends on indicators.

If price bounce off the lower channel on 4hr chart, I'll go for a long hedge (depende on indicators), Then from there... I'll open a long hedge positions with TP on the upper channel.

From what the indicators are showing right now. I think EUR/CHF will make a corrective down before it rally to the upside.

Note: Daily chart is still bear bias unless price closed higher than yesterday close price.

xxxxxxxxxxxxxxxxxxxxxxxxxxxxxxxxxxxxxxxxxxxxxxxxxxxxxxxx

Nice trade yesterday. I captured the rally up and scalp the up and down ranges. Nice results will be seen by PMTFC pool members this weekend.

Caffeine shots has nothing to do with the good results, 'coz not a single soul is kind enough to treat me a shot (lolz), Hey! IP address ending with 14, You owe me a drink (lolz). hmmm... probably the inspiration I'm getting from my new found Canadian gal. I love you Lorie! ;-)

Forex News: USD Mired Near Lows

The dollar’s woes were exacerbated as more evidence of problems in the subprime mortgage market were revealed yesterday – triggering a sharp sell-off to record lows against the euro at 1.3786 and a new 26-year low versus the sterling at 2.0285. The heightened risk aversion also prompted speculators to scale back carry trade positions, sending the yen sharply higher – climbing to 120.96 versus the greenbucks and recovered from all-time lows against the euro.

The main catalyst was attributed to S&P’s announcement that it would possibly downgrade nearly $12 billion in subprime mortgage-backed US bonds. The move could potentially add more instability to financial markets and raising warning flags of spillover effects to other sectors of the economy. Also boding poorly for the housing market and consequently, the US economy were earnings reports – in which Home Depot signaled further weakness ahead by issuing profit warnings due to the housing slump.

The euro finally surpassed its previous record high against the dollar set in April, jumping to 1.3786 amid renewed fears from the US housing market. The single currency is poised for further gains this week ahead of several key Eurozone economic reports, set to reveal greater divergence between the US and Eurozone economies.


Source: forexnews.com
Author: Korman Tam

This gives the answer why carrys are unwinding at the moment and support my analysis of a long term bear bias is still intact.

7.11 Perfect Candidate

Photo Sharing and Video Hosting at Photobucket

9:03pm EST- Descending Channel formed on EUR/CHF pair 1h chart.

- Stoch crossed above 20 level; CCI crossed above -100 level.
- Right at 61.8 strong fibo level.
- Inverted hammer formed (1) followed by a pin bar (2).
- Broke above upper channel.
- ADX bear is losing its momentum.

All that mentioned above makes a perfect candidate for a reverse to the upside. But I might be wrong... I still want to see it dip to the 1.6500 before it make a U-turn. Reversing at the current price level seems a bit awkward to me. hmmm... probably that might just make a small retrace to the 72EMA purple line. I opened a 3% risk buy hedge at this level... just in case...

Long term trend is still down, so be careful when hedging both long (buy) positions.

xxxxxxxxxxxxxxxxxxxxxxxxxxxxxxxxxxxxxxxxxxxxxxxxxxxxxxxx

The long hedge positions I opened yesterday, I closed it at profit a few hour ago. Then, I scalped the down move. Long at 1.6536 (A); closed at 1.6574 (B), then long again at 1.6523 (C); closed at 1.6543.

Yesterday trades was/has the best results for PMTFC account since the cycle 2 started 5 weeks ago.

EUR/CHF 7.10 analysis

Lets hang some art work.

Photo Sharing and Video Hosting at Photobucket

On the daily chart. Pin bar formed 3 days ago, a good indication of a down move. Stoch indicator about to cross down. Price might drop to the round number 1.6500, which also in confluence of a major trendline support and 61.8 fib of the last swing up. Overall is a bear bias.

Photo Sharing and Video Hosting at Photobucket

On 4H chart. Price just touch the lower bollinger band and 50 fibo of the previous major swing. Indicators are in the oversold zone, but need to cross above the -100 CCI and 20 Stoch level to confirm a possible retrace.

Photo Sharing and Video Hosting at Photobucket

Yesterday, I said "the retrace up might be a short one", after that... "it might cross below the trendline". Indeed it retraced (5 & 6 on the chart) and crossed below the support line, but the retrace was too short from what I'm expecting. I was thinking of a retrace up to 1.6588 or 1.6593 (61.8 and 76.4 fibo of the down swing) before head south.

Right now, it is already heading south as I predicted. Indicators are in the oversold zone, I'm hoping for a nice bounce to the 1.6575 area or back to the previous support trendline that turns resistance before in continues to go south again.

Note: Pay attention to the round number 1.6500.

7.9

Photo Sharing and Video Hosting at Photobucket

EUR/CHF just touch the target (TP) I set last friday. The TP is the trendline connected by July 3 lows (A) and July 5 lows (3).

On 1hr chart, the TP or the price right now is also where the 72EMA lays. Indicators shows oversold. A possible of a retrace.

On 4hr chart, Indicators still pointing down. And at the middle of the Bollinger bands.

On daily chart, a pin bar might be form if price ends lower that the highest high last week. Stoch and CCI are at overbought zone to some extent, starting to curve down. Still need the current candle to close to confirm a long term bear bias.

My next step is to open a set of buy hedge with 5% risk equity. If the indicators on 4hr and daily chart are not pointing down, I might set the target at the upper trendline, but since they are pointing down... the retrace range might be a short one. I will just use 1h chart indicators to decide to close these (buy) positions.

If price didn't make a retrace from here and crossed down the lower trendline, I'll open another buy hedge at a lower price.

Market Crash Ahead?

Currently, The Asian, US and elsewhere stock market looks healthy. The problem in the US housing market is "contained" in the subprime sector. Everything seems to be robust...

But what others don't know is that the risk of loss is always at its highest on the precise moment that most people judge it of least concern. Eventually, prices would reach its tipping point... a moment of desperate reality... another market crash. Most likely, there will be no crash tomorrow nor the day after. But there are some things you are better off preparing for, even though they may not happen for a while.

Here are some of the concerns that traders should focus on in the coming days.

1. The Chinese stock market is getting hit hard. Its CSI 300 Index is down 17% in the last three weeks. Brokerage account openings have dropped by two-thirds. Could global hot money... and local cold cash…turn bearish on Chinese shares? Could this trigger a worldwide equity sell-off? Yes it might.

2. The dollar is in trouble. The Friday's NFP released data was in favor for the dollar but it didn't help much. On Wednesday, it hit its lowest level against the pound (GBP) in 26-years. It is now near its lowest level ever against the euro. Trillions worth of dollars now sit in foreign vaults. while reserve managers openly talk of diversifying away from greenbacks. Foreigners don't have to abandon the dollar in masse to knock it down, all they have to do is to let up on their purchases of dollar-denominated assets - such as U.S. Treasuries. Could it happen? Could the shock cause a crash in major financial markets? Why.. yes... it might.

3. All paper currencies are dangerous. The dollar is not the only paper currency in the world whose supply is growing rapidly. Practically every central bank is printing up its own money in vast quantities - trying to keep up with the U.S. brand. This is why the world has so much "liquidity." It's why so many assets are rising in price so steeply. But could investors suddenly become fearful of so much monetary inflation? Could consumer prices shoot up as asset prices already have? Could the world's people want to get rid of their paper currencies in favor of other stores of value - notably gold?

4. A Milan-based bank, Italease, has just seen its derivative portfolio blow up. So has Bear Stearns (BSC). Large lenders are getting skittish of complex debt instruments, just as more deals than ever before come to market. So far this year $1 trillion in deals have been done in the North America - a rate of deal-making nearly 50% higher than the year before. What happens if the wheeler-dealers don't find the credit they're looking for? What would investors think if even one of these mega-deals blew up badly?

5. The Bank of England raised its key interest rate on Thursday by 25 basis points to 5.75 percent, another six-year high. This is the fifth time this year. The ECB's Trichet held steady this month but hints that rates will go up in the future. Elsewhere, banks are likely to hike rates too. And watch out if the Chinese decide to do some serious tightening.

Could there be even bigger blow ups waiting to happen? And could they cause a stampede for the exits? Anthony Bolton, Britain's most successful fund manager, worries about it. So does the Bank of International Settlements. And so do central bankers in Madrid, London and who knows where else. And if the pros stop lending so freely, might not it trigger a credit crunch and a crash?

For the last 2 weeks. The majors just did a range bound. If you look at it in a medium term chart, market is indicision phase. The after effect of this would be a breakout, whether a big reversal or a continues steep down... we don't know yet. But we will keep our eyes open.. and keep our ear on the ground.

7.6

Photo Sharing and Video Hosting at Photobucket

July 6 (6:45 EST)- The Green line is the same trendline I drew on my (4h chart) post last July 3. I said breached of that line means continuation of the up move, This is the number 1 on the chart above.

On my post right before this one. I said "EUR/CHF pair broke the upside trendline, but indicators are showing overbought. Might have to wait for a dip to get in". This is the number 2 on the chart.

On number 3, the dip stopped at the same exact trendline with confluence of lower ATR and 61.8 fib level. Then make a reverse to the number 4, which lays the confluence of the new "mid term" trendline and upper ATR. Indicators also showing overbought, so price might bounce there.

If you draw a trendline from "A" to "3". This might be the next stop before resume of the uptrend. Take note that the price just reach higher than the previous highs. This is a good indication of long term bull bias.

Just my observation. Trade it at your own risk.

Size Does Matter

It is often said that to grow as a person that you have to stretch and move out of your comfort zone. I definitely believe in this concept, however…

When it comes to trading stocks, futures, options or forex, stepping outside your comfort zone can be dangerous!

Let me explain… Say, a trader is used to trade 10% of his/her equity at a time, with the average value of 10% risk, They are very comfortable putting this amount at risk. What's more, they never experience any anxiety and can sleep well at night at this level.

However, watch what happens when these traders decide to up their ante to 15 or 20% risk margin. All of a sudden they are worried about every tick against them and start riding an emotional roller coaster based on the current price of the currency.

At these levels they become much more emotional and their judgment becomes cloudy. As a result, they start making bad decisions that never occurred at the 10% risk margin level.

A good idea is for you to take a good hard think about what "size trader" you are and where you are completely comfortable at. Write these numbers down and force yourself to never deviate from them.

When the time does come to raise your bet size up, do it in small increments over time.

I assure you, that by sticking to this simple concept that it will make trading a much more comfortable and profitable experience.

Be patient and stay focused and the money may roll in at levels you never thought possible!

Happy 4th of July!

Photo Sharing and Video Hosting at Photobucket

The US dollar was steady against other major currencies in morning trading here Wednesday as players remained on the sidelines before the Independence Day holiday in the US.

All 4 majors trend sideways since this morning. Thin liquidity is expected to persist until Thursday's announcements about interest rates in the UK and the euro zone. ECB is expected to keep rates on hold, while BOE is expected to raise rates by 25 basis points.

European bonds are trade lower in today’s session following an unwinding in safe haven flows as market participants jump back into equity. This is good news for carry trades.


EUR/CHF pair broke the upside trendline, but indicators are showing overbought. Might have to wait for a dip to get in.

GBP/CHF pair trend sideway with overbought conditions.

End of New York session 7.3

Photo Sharing and Video Hosting at Photobucket

Price bounce off the 76.4 fib and make a run to 1.6550 where it hit a trendline. Stoch and CCI shows overbought, we might see a bear move from here. Breach of the trendline envisage a continuation of the bull run.

Take a closer look on the earlier 76.4 fib bounce, all 3 indicators suggesting reversal. Another 2 pips worth.

Objective Mindset for Profitable Trading

Source: My FXroundtable yahoo group
Author: hunting4pips

In an interview with one of my colleagues several years ago, Curtis Faith described the mental edge he had over the other Turtles that made him the top performer: "I had a very detached perspective. I did not get emotionally caught up in things. And so I had the type of personality that made it easy for me to withstand long-term periods of losses. That let me continue to execute, and it let me approach a problem differently from the other Turtles." It is difficult to prevent feelings of anxiety, frustration, and loss from interfering with trading. When many traders face a drawdown, they feel stuck and afraid. But winning traders stay detached and objective. And that allows them to survive, continue trading, and get out of drawdowns.

If you are passionate about what you do, it can be difficult to avoid putting your ego on the line with every trade you make. And when your ego is on the line, it's difficult to stay objective. You may know intellectually that you shouldn't take the outcome of a trade personally, but you do. It's natural to show some concern about the outcome of a trade. Whether you are a systems trader, a discretionary trader, or a combination of both, wins and losses matter and it is often hard to keep feelings of euphoria, relief, frustration, and disappointment out of the picture.

Humans naturally avoid risk. They don't like losing. People are willing to gamble a large sum to avoid a potential loss than immediately accept a smaller but certain loss. Novice traders have difficulty taking risks. They don't have a rock solid track record, so they are not sure what to expect. Besides a lack of experience, many novice traders have limited capital. In the back of their mind, they hope that they will make enough winning trades to make up for losing trades. The pressure to
meet these expectations can be daunting, however. In an effort to do well, a typical novice may put on a trade that is too large, and may not delineate or follow an adequately detailed trading plan, in a fruitless attempt to get ahead or make up losses. But these actions are overly emotional. They are impulsive and based on fear, rather than on a cold, objective analysis of available information.

It can be difficult to take a long, hard look at your chances of success, especially when you feel the pressure to perform in an uncertain enterprise like trading. That said, in many ways, trading the markets is much like other businesses. For example, if you were to open a small convenience store, you would need to make an accurate assessment of the perishable goods you could sell. If you buy too little, customers
may be put off when they can't buy the products they need and you may lose customers. On the other hand, if you stock up on too many products, they will go bad, and you will end up losing money. Your survival depends on your ability to anticipate what your customers want and recover from changes in their demands. In running your trading business, you may not need to lease retail space or maintain an
inventory, but you do need to take risk, anticipate setbacks, and figure out a way to survive. People are inconsistent and difficult to predict. Your plans may not always come to fruition. The fickle nature of the markets demands that you have extra capital to weather the storm and reliable trading strategies that have a statistical edge.

Losses are a fact of trading. There is no such thing as a foolproof trading system. In the end, traders must look at the odds of success and live with the uncertainty of the outcomes. Across a series of trades, you may have to deal with losing streaks as well as winning streaks. Market conditions change with minor and major events. Last week, for example, we saw the impact of an impending fed announcement, but future world events may also impact the markets. Even without these events, though, the masses may change their mind regarding their perceptions of the markets. Sometimes, the masses behave according to prescribed and consistent patterns, but sometimes they do not. And that is where uncertainty really comes in.

Why do some traders fear uncertainty? People are used to protecting their resources. We like to believe that we can protect our assets, whether they are property, stocks or bonds. But trading the markets is risky, and loss is a certainty. Even if you use a trading system with a solid track record, profits are not guaranteed. Across a series of trades, a string of losses and a resulting drawdown can wipe out profits. It is common in some cases to lose 50% of one's account or more, even with a system or strategy that will produce a decent return over the long run. Living with such uncertainty is vital. You must have both psychological and financial resources to survive.

When your capital is limited and you are taking on too much risk, it's hard to control your emotions. Since you are not risking money that you can afford to lose, it is difficult to fool yourself into believing that you are. It is hard to forget that real money is on the line, and that losing your stake is quite possible. However, it is vital to take a realistic approach to trading. Take a hard look at your capital and your past trading performance. Based on your past track record, determine how much you can make realistically. Remember that drawdowns and setbacks
are a fact of trading, so it is necessary to honestly evaluate your trading skills, your financial resources, and your commitment to success. As simple as it sounds, many traders have difficulty facing their personal and financial limitations. But the only way to succeed is to accept your limitations and figure out a way to get past them.

Cultivating a rational, objective mindset is essential for profitable trading. But when your money is on the line, it can be hard to remain objective. If you are riding a rollercoaster ride with regard to your emotions, however, it may reflect real fears. The only way out is to take an honest look at your personal and financial resources and find capital, reliable trading strategies, and the committee to gain the experience you need to trade with the proper mental edge.

7.3

EUR/CHF is in a consolidation phase right now at 1.6490 after a hard drop yesterday. 1.6490 which is also the 76.4 fibo of 1.6416 low to 1.6667 high. 76.4 fibo is the last strong support level. (4h chart) Candle closing below it could get the price to 1.6416 (100 fibo) or 1.6350 (127 fibo); While fail to breach 76.4 fibo will resume the bullish reversal. The GBP/CHF is at the same situation as the EUR/CHF, almost identical.

On the daily chart, a bearish engulfing candle formed 3 days ago, suggesting a downtrend bias.

According to one elliot wave practitioner, it should drop atleast to the 1.62 level, before we can see a total reversal. gee... I don't know, I hope not.

On the fundamental side. US stocks rally with Dow up 126 on Monday. Bear Stearns concern eased. Swiss annual consumer inflation rate rose 0.5% from last March of zero, a continues .3% monthly increase would increase pressure for a more aggressive monetary tightening, which will force SNB to rise their interest rate. Overall, fundamentals contradict to each other. I will just stay aside, and only place small baits once a saw possible opportunity.

xxxxxxxxxxxxxxxxxxxxxxxxxxxxxxxxxxxxxxxxxxxxxxxxxxxxxxxxxxx

Last week update:
PMTFC end the week with 3439 equity. While TN account ended with 7370.
Not much difference from the previous week results, since EUR/CHF is in range bound the whole week.

To clarify something. This blog is not set-up to compare PMTFC's account with TN's. Both strategies are different though both are hedging correlated pairs, starting equity are different, risk percent used are different and the close and opening of positions are not at same levels.