Aug. 7 (2:40am EST)- EUR/USD has been on a range bound mode since the market open this week, with the high at 1.3838 and low of 1.3778. Since there would be a Fed interest rate announcement later, I'm expecting a breakout from the 2 levels that I've mentioned.
An opportunity arise for a breakout straddle. Here's what I'll do:
- Set buy stop at 1.3843, 1.3858 TP with SL of 1.3775
- Set sell stop at 1.3842, 1.3758 TP with SL of 1.3842
If a few minutes before the US interest rate announcement and the price is still at the middle of the buy and sell levels, I'll cancel the orders. It should be near or passed neither orders. .... and probably will put a trailing stop (depends on indicators).
Since I have bagged $145 yesterday for Volker account, even if the straddle didn't work out, it won't hurt much.
Please be remind that this site is not a signal service provider. I'm just posting what I'm doing on my managed portfolios. Trade it at your own risk.
XXXXXXXXXXXXXXXXXXXXXXXXXXXXXXXXXXXXXXXXXXXXXXXXXXXXXXXXXXX
GBP/JPY 4h chart seems to be forming a inverted head & shoulder. Price must pass above 243.11 neckline to confirm an uptrend. Since EUR/CHF is a follower of GBP/JPY, the confirmation of the H&S formation will be also uptrend for the EUR/CHF.
EUR/CHF on the daily chart seems also forming a double bottom, but the formation is not that clear as the GBP/JPY. Price need to cross above 1.6534 neckline to confirm the formation. 1.6687 is the target if neckline broke. Bearish bias is still intact unless 1.6534 is breached.
Dow Jones healthy gains yesterday also support the above views.
Showing posts with label signal. Show all posts
Showing posts with label signal. Show all posts
Opportunity to Straddle
Posted by
HARWIN
at
2:44 PM
0
comments
![]()
Labels: double bottom, dovish, GBP/JPY, interest rate announcement, signal, straddle
Channel Lines Part 2
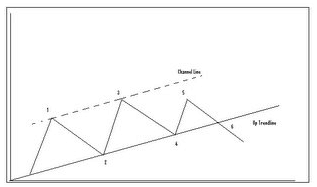
The channel technique can also be used to spot failures to reach the channel line, signaling the weakening of a trend. As a general rule the failure of any move within an established price channel to reach one side of the channel, usually indicated the trend is shifting and increases the chances that the other side of the channel will be broken. See below how the failure of prices to reach the channel line at point 5 serves as an early warning the trend is turning and increases the odds the trendline will be broken.

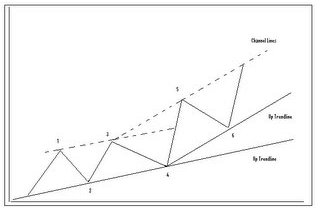
A channel can also be used to adjust the basic trendline. Below, note when the channel line is broken with point 5, our trader drew a new trendline parallel to the new up channel line. With the uptrend accelerating, it stands to reason the basic trendline will accelerate as well.

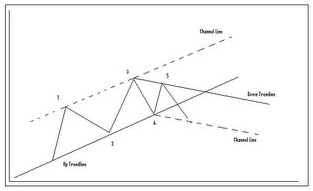
When prices fail to reach the channel line, as seen below, a down trendline can be drawn between points 3 and 5, and tentative channel line can be drawn parallel from point 4 to show where initial support can be seen.

The measuring implications of the channel line state once a breakout occurs from the existing price channel, prices usually travel a distance equal to the width of the channel. So the trader simply measures the width of the channel and projects the amount from the point at which either trendline is broken. Even though the channel line works often enough to be a very useful tool, remember, it's the basic trendline that is most important.
Subscribe to:
Posts (Atom)


