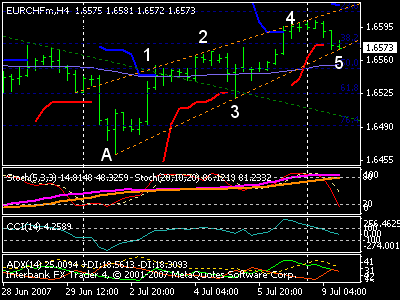
EUR/CHF just touch the target (TP) I set last friday. The TP is the trendline connected by July 3 lows (A) and July 5 lows (3).
On 1hr chart, the TP or the price right now is also where the 72EMA lays. Indicators shows oversold. A possible of a retrace.
On 4hr chart, Indicators still pointing down. And at the middle of the Bollinger bands.
On daily chart, a pin bar might be form if price ends lower that the highest high last week. Stoch and CCI are at overbought zone to some extent, starting to curve down. Still need the current candle to close to confirm a long term bear bias.
My next step is to open a set of buy hedge with 5% risk equity. If the indicators on 4hr and daily chart are not pointing down, I might set the target at the upper trendline, but since they are pointing down... the retrace range might be a short one. I will just use 1h chart indicators to decide to close these (buy) positions.
If price didn't make a retrace from here and crossed down the lower trendline, I'll open another buy hedge at a lower price.
7.9
Posted by
HARWIN
at
5:10 PM
![]()
Subscribe to:
Post Comments (Atom)


0 comments:
Post a Comment