Lets hang some art work.
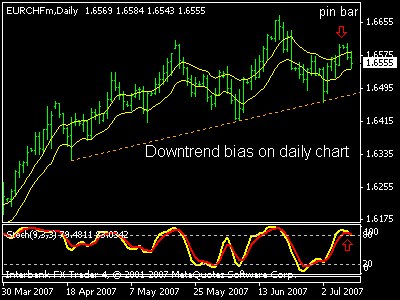
On the daily chart. Pin bar formed 3 days ago, a good indication of a down move. Stoch indicator about to cross down. Price might drop to the round number 1.6500, which also in confluence of a major trendline support and 61.8 fib of the last swing up. Overall is a bear bias.
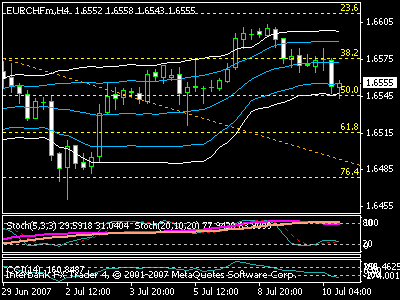
On 4H chart. Price just touch the lower bollinger band and 50 fibo of the previous major swing. Indicators are in the oversold zone, but need to cross above the -100 CCI and 20 Stoch level to confirm a possible retrace.
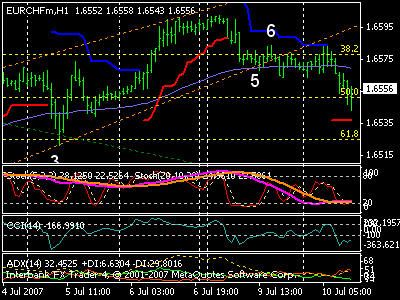
Yesterday, I said "the retrace up might be a short one", after that... "it might cross below the trendline". Indeed it retraced (5 & 6 on the chart) and crossed below the support line, but the retrace was too short from what I'm expecting. I was thinking of a retrace up to 1.6588 or 1.6593 (61.8 and 76.4 fibo of the down swing) before head south.
Right now, it is already heading south as I predicted. Indicators are in the oversold zone, I'm hoping for a nice bounce to the 1.6575 area or back to the previous support trendline that turns resistance before in continues to go south again.
Note: Pay attention to the round number 1.6500.
EUR/CHF 7.10 analysis
Posted by
HARWIN
at
8:54 PM
![]()
Subscribe to:
Post Comments (Atom)


0 comments:
Post a Comment