


One of my blog followers ask me which weighted the most when deciding which directions to go. My answer would be channel lines, followed by Fibonacci levels, then confirm it with the Stoch and CCI indicators. The 72EMA and Daily ATR are just stoppers, price don't "always" bounce there but they "usually" do. And the not so important tools in my arsenal are the RSI, ADX and Bollinger Band. The RSI and BB shows overbought/oversold of a currency pairs just like what Stochastic Ocillator do. The ADX can be replace with volume and momentum indicators.
When hedging correlated currency pairs using carrys chart as a gauge, combining the tools mentioned above with Freedomrocks software or the True North Concepts Hedge Calculator can be a very safe and profitable technique. But remember to use less margin when going against a trend, or if possible... don't counter trade.
We will discuss about channel lines today. How to plot them, how useful can it be.
A channel line, or as it as sometimes called, return line, is a variation of the trendline technique. Occasionally, prices will trend between two parallel lines, the trendline and the channel line. This event can be used to a profitable advantage once the trader recognizes that a channel exists.
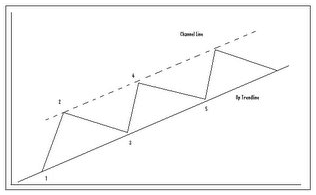
Looking at the uptrend above, a channel line can be drawn at the first prominent peak (point 2). If the prices dip back down to the trendline at point 3, rallys back up to the channel line at point 4, and dips back to the trendline at point 5, then a channel does exist. The same is true for the downtrend below, except for the dips and rallies being reversed in a down direction.
Do you see the value here? All treaders, where day trading, swing or options trading can use the basic up trendline to initiate new long positions, and the channel line provides points for taking short term gains. just like the basic trendline, the more times a channel is successfully tested and remains intact, the more important and reliable it is. The more aggressive trader may initiate a countertrend short position here, but keep in mind trading in the opposite direction of the prevailing trend is a dangerous and costly tactic if it fails.
Whereas the breaking of a trendline indicates a probable trend change, the breaking of the rising channel line has the opposite meaning. It signals the acceleration of the existing trend. Here some traders see the breaking point of the cahnnel line in an uptrend as the opportunity to add long positions.

0 comments:
Post a Comment