









This post is for those who are trading the True North Concepts and/or FreedomRocks Hedge.
Image below is a EUR/CHF "daily" chart. This might take days or a week to complete its formation.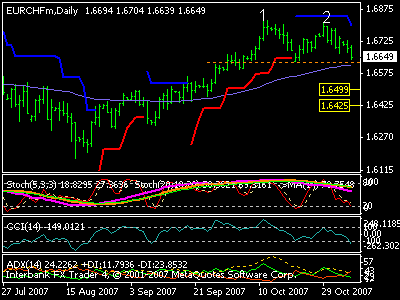
- Double top is forming (1 & 2), which means a strong reverse down is about to happen if price break and closed below the neck line (orange line).
- Short & long term Stoch is pointing down.
- CCI just entered its oversold zone.
- ADX shows rising of bearish momentum and volume.
If price broke and "closed" below the neckline, we might see the price down to 1.6500 or 1.6425. That's 50% and 61.8% fibo of the previous swing up.
However, if it fell to break the neckline and bounce off the 32.8 and 72EMA (lavander line), we might see a continues uptrend. Pay attention to the 2 tops levels then, for it might form a flag (wedge) formation from there.
Hedge your way to riches. Click Here!
11.6 EUR/CHF Analysis

Channel Lines Part 1
One of my blog followers ask me which weighted the most when deciding which directions to go. My answer would be channel lines, followed by Fibonacci levels, then confirm it with the Stoch and CCI indicators. The 72EMA and Daily ATR are just stoppers, price don't "always" bounce there but they "usually" do. And the not so important tools in my arsenal are the RSI, ADX and Bollinger Band. The RSI and BB shows overbought/oversold of a currency pairs just like what Stochastic Ocillator do. The ADX can be replace with volume and momentum indicators.
When hedging correlated currency pairs using carrys chart as a gauge, combining the tools mentioned above with Freedomrocks software or the True North Concepts Hedge Calculator can be a very safe and profitable technique. But remember to use less margin when going against a trend, or if possible... don't counter trade.
We will discuss about channel lines today. How to plot them, how useful can it be.
A channel line, or as it as sometimes called, return line, is a variation of the trendline technique. Occasionally, prices will trend between two parallel lines, the trendline and the channel line. This event can be used to a profitable advantage once the trader recognizes that a channel exists.
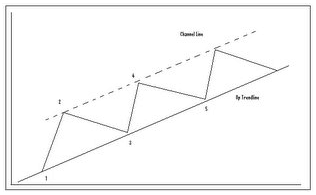
Looking at the uptrend above, a channel line can be drawn at the first prominent peak (point 2). If the prices dip back down to the trendline at point 3, rallys back up to the channel line at point 4, and dips back to the trendline at point 5, then a channel does exist. The same is true for the downtrend below, except for the dips and rallies being reversed in a down direction.
Do you see the value here? All treaders, where day trading, swing or options trading can use the basic up trendline to initiate new long positions, and the channel line provides points for taking short term gains. just like the basic trendline, the more times a channel is successfully tested and remains intact, the more important and reliable it is. The more aggressive trader may initiate a countertrend short position here, but keep in mind trading in the opposite direction of the prevailing trend is a dangerous and costly tactic if it fails.
Whereas the breaking of a trendline indicates a probable trend change, the breaking of the rising channel line has the opposite meaning. It signals the acceleration of the existing trend. Here some traders see the breaking point of the cahnnel line in an uptrend as the opportunity to add long positions.
Friday the 13th
Today is Friday the 13th and also the last day of the trading week. For those directional traders who has paraskavedekatriaphobia, their heightened state of anxiety or fear could have save them from the whipsaw that happened to the majors earlier. It has some advatages being superstitious sometimes, it makes you more caution of things that happening around you.
We had 2 economic news announcement earlier. The Retail Sales (8:30am) and the Consumer Sentiment (10:00am). The 8:30 numbers came out way lower than expected and the 10:00 numbers which is the more important one (for inflation gauge) came out far better than expected. This 2 contradict announcement causes the whipsaw. I bet a lot of small players trading the directional ways with tight stoploss got stopped out on that.
This is the reason why I don't trade the news and hedge the market instead. To know more about the tools I'm using. You may contact/email me at harwin21@yahoo.com. I can set you up with my friend (MikeQC) who is an active sales rep for FreedomRocks. He'll walk you through the process and give you a free trial for the FR software.
For the other tool that I'm using. Which is the True North Hedge Calc., You may just click the yellow banner on the sidetab of this page.
EUR/CHF ended the week with only 7pips below the opening price of this week (1.6594). There were lots of buy & sell hedge opportunities on the small range bounce. I had a great trading week, hope you guys aswhile. Happy weekends everyone!
