


EUR/CHF 1h chart. After a steep drop early last week, it stays in a consolidation for 3 days, ranging within 1.6196 and 1.6083. And finally broke to the downside just before the market close last friday.
Double top is formed. EMAs pointing down suggesting a continues bear.
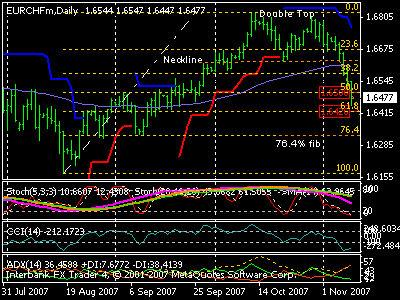
A bigger double top formation formed. All indicators are at oversold territory, but still has room for the down side. I'm expecting it to test the 1.6033 first then reached the psychological level of 1.600 on or before the fed rate announcement on January 30. Wait for the confirmation of a reverse on the dailies before placing a buy hedge.
www.truenorthfx.com
Showing posts with label analysis. Show all posts
Showing posts with label analysis. Show all posts
EUR/CHF 1.21.08 Analysis

Fed Should Prop Up Dollar
In a recent editorial published in the Wall Street Journal, the Chief Economist for Bear Stearns (an American investment bank) advocated intervention by America's Federal Reserve Bank on behalf of the Dollar. He reasons that the best way both to fight and inflation and alleviate the possibility of recession is to strengthen the USD. Current measures, which include lowering the discount rate and manipulating the money supply, are actually worsening inflation. As a result, institutional investors are moving their capital en masse outside the US in order to prevent the declining dollar from corroding their investment returns. While paying lip service to the prevailing wisdom that Central Banks are essentially impotent when it comes to managing currencies, he insists that strong rhetoric by the Fed could conceivably convince investors that it stood behind the "Strong Dollar Policy" it promotes.
1.9.08 EUR/CHF Analysis

From my last report, EURCHF bounced off the lower trendline as expected. Supported by the news announcement the US will soon cut their tax rate, and a possible 50 basis point cut on interest rate next meeting, which help the carrys make a nice rebounds after last friday slump.
The above chart is EURCHF dailies at 1.6400. I'm expecting it to touch the upper trendline or at least in the middle of the last swing down in the a couple of days to come. Breaking of the upper trendline will confirmed a bull trend, which is good for truenorthfx hedge. While a bad news can pull the price down to at least 1.6200 or even lower.
1.4.08 EUR/CHF Analysis
EUR/CHF Daily Chart
A side by side double top that I missed. Dragging the price down to the lower trendline. Stoch & CCI both are oversold but ADX showing strong bearish volume. Are we gonna see a reversal here?
If it bounced, expect price to touch the upper trendline. If it broke below, expect target or reversal at 1.6218. 2nd target or reversal point is at the round number 1.6000.
The above chart is a daily chart for long term view. Don't expect to see price reached targets in a single day trade.

EUR/CHF 12.21 Analysis

Zooming in to the 1h chart, EURCHF caught in a range within a channel. Break of the lower channel will test the previous strong support at 1.6550, thats the 61.8 fib of the 12/05/07 low to 12/14/07 hi swing. Breaking the upper channel will test the major trendline I mentioned on my earlier post.
Right now, 1h and 4h are in bear bias with 72EMA so flat showing to clear direction. Daily chart showing a possible bull forming, but Stoch and CCI curved up at the middle of OB & OS, which makes me hesitate to conclude a bull. 1h to daily ADX shows no (low) momentum since monday. I will still stay aside while holding some drawdown positions.
This next analysis has nothing to do with true north hedge trade. Just pointing out how to use the template I sent out to our members. 
NZDUSD dailies is also within a uptrend channel. Stoch & CCI about to crossed up. Price having a hard time breaking the lower channel. If broke, target would be the 50% fib (.7290). Enter at 0.7420 confirmation, set SL at the lower channel.
However, if price bounced from the lower channel. Set entry at 0.7640 with TP at the upper channel, SL at 0.7420. This is a long term trade which moght take days to reach the target. Trade it at your own risk. Not recommended to included this trade with your hedge trade account.
EUR/CHF 12.18 Analysis

EURCHF daily chart- It broke the (minor) support trendline yesterday with great volume suggesting a bearish trend formed.
Price now at 1.6550, 50% fib of Oct. 29 high to Nov. 23 low. Confluence with the 72EMA (purple line). I think price will bounce a bit from here before go down further.
Game Plan: If it make a upward correction today, and your positions reached breakeven, close it. Stay away from the market 'til the upper trendline (orange line) on the daily chart is broke. Lower trendline is a good level to start a long hedge, if you still have enough margin left to risk. But before that, watch out on 1.6500 to 1.6450 level, another minor support level before the lower trendline.
EUR/CHF 12.11 Analysis
Short term (Intraday)
Now at 1.6595. EUR/CHF broke 1,6575 resistance. EUR/CHF is in an uptrend supported by daily chart's indicators. The volatility is high. 72EMA 1H, 4H are in a bullish configuration. 1H, 4H, dailies Stochastic indicate a bullish pressure on EUR/CHF.
The uptrend should continue to gather momentum. Wait for a minor retrace on 1h chart before entering a long hedge. Use True North Hedge Calculator to determine the number of lots to buy on EUR/USD and USD/CHF pairs,

Mid Term View
The EUR/USD has already dropped to key support at 1.4725 and has bounced back up. The pair is most likely going to continue moving in a sideways range between 1.4725 and 1.4875. If some other piece of bullish USD news does happen to come out within the next day or two, the EUR/USD may drop down to support at about 1.4625, but that is where the buck stops.
You will see similar movement with the USD versus the Japanese yen (JPY) and the CHF. Both the USD/JPY and the USD/CHF have risen to key levels of resistance and will most likely turn back around and fall back into sideways trading ranges.
Don't try and chase this bullish USD move just yet. You will find some trading opportunities as these pairs trade in their ranges, but you should keep you time horizon on your trades a little shorter.
Weekend EUR/CHF
On my previous post. I stated that EUR/CHF pair should continues its bear trend once price on 4h chart closed below the 74.6% Fibo of its major swing up at around 1.6330.
I have to make a correction there. Since the Fibonacci we are looking at is from a major swing, it is appropriate to check the price action at a bigger time frame.
Price did closed below that level on 4h chart, but on the daily chart... it didn't. The last candle/bar on the dailies ended with a pin bar. If on monday, the closing bar is higher than last friday's closing price. The pin bar will be confirmed.
However, I also placed a sell stop order 5 pips below friday's low. This is to safeguard if ever EUR/CHF continues to drop on Monday.
On friday, the fundamental standpoint supports the further carrys unwinding view. However, just yesterday I heard Brazil central bank start to intervene by purchasing massive quantities of Dollar-denominated assets in the open market. Canada and Japan are at risk, hope they follow suit.
11.14 Analysis
EUR/CHF
1,6439. EUR CHF is in an downtrend directed by 1H exponential moving averages. It is in a consolidation after the last bearish movement. The volatility is low. Bollinger bands are flat. 4H Trend Indicator is in a bearish configuration. 4H Stochastic crosses and gives a positive signal. The price should continue to consolidate. The price should find a resistance below 1,6470. If the resistance is broken then the target will be 1,6550.
Resistances
1,6450 - 1,6470 - 1,6500
Supports
1,6420 - 1,6380
EUR/USD
1,4611. EUR USD is in an uptrend supported by 4H exponential moving averages. EUR USD is in a range between 1,4510 and 1,4750. The volatility is high. Oscillators are neutral. The price should continue to consolidate. I won't take a position.
Resistances
1,4630 - 1,4730
Supports
1,4570 - 1,4520
EUR/CHF, EUR/USD & GBP/USD Analysis for Monday
EUR/CHF- Might find a way to touch 61.8 fib of the previous up swing. 1.6422 to 1.6400 before a possible nice rebound.
Resistances
1,6505 - 1,6560
Supports
1,6470 - 1,6450
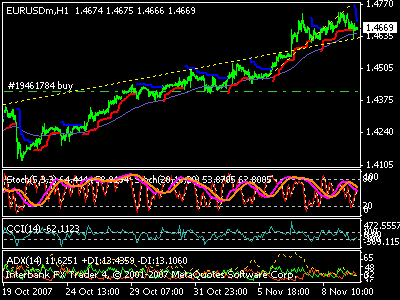
EUR/USD- Just bounce off a major trendline. an uptrend supported by 1hr Stoch and CCI. The volatility is high. A parallel channel can be drawn to form a trend. My trend indicator 4hr and daily is in a bullish configuration. The price should continue to consolidate with bias to the upside. The price might continue to move in 1,4660 - 1,4730 range. I won't take a position. The risk/reward ratio is too high to take a position.
Resistances
1,4730 - 1,4750
Supports
1,4670 - 1,4615
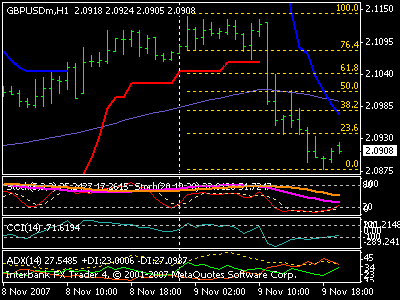
GBP/USD- Just fomed a pin bar 3hrs before the market close of last week. Trend bias is bull on higher TimeFrames. 1hr Stoch and CCI crossed significant levels up.
Trade suggestion: Open a long position as soon as the market open, set TP at 38.2 fib and 2nd TP at 50 fib of the last swing down. That's 2.0977 and 2.1009. SL at 2.0800. Adjust SL to breakeven if price passed 2.0940. Trail stop the 2nd position if you want. Trade at your own risk.
Best time to use the True North Hedge. Learn it HERE!
EUR/CHF 11.8 Analysis
1,6595. EUR CHF is in an downtrend directed by 1hr 72EMA. The volatility is low. My trend incicators are in a bearish configuration. 1hr Double timeframed Stochastic indicate a bearish pressure on EUR CHF. The price should find a resistance below 1,6610. The downtrend should continue to gather momentum. The target is expected at 1,6550.
Resistances
1,6610 - 1,6640
Supports
1,6570 - 1,6550
11.6 EUR/CHF Analysis
This post is for those who are trading the True North Concepts and/or FreedomRocks Hedge.
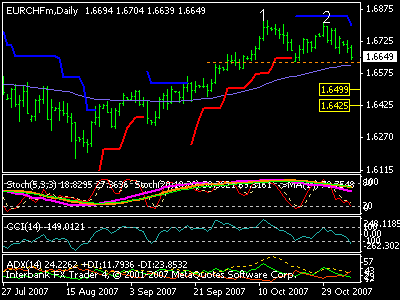
Image below is a EUR/CHF "daily" chart. This might take days or a week to complete its formation.
- Double top is forming (1 & 2), which means a strong reverse down is about to happen if price break and closed below the neck line (orange line).
- Short & long term Stoch is pointing down.
- CCI just entered its oversold zone.
- ADX shows rising of bearish momentum and volume.
If price broke and "closed" below the neckline, we might see the price down to 1.6500 or 1.6425. That's 50% and 61.8% fibo of the previous swing up.
However, if it fell to break the neckline and bounce off the 32.8 and 72EMA (lavander line), we might see a continues uptrend. Pay attention to the 2 tops levels then, for it might form a flag (wedge) formation from there.
Hedge your way to riches. Click Here!
Subscribe to:
Posts (Atom)
