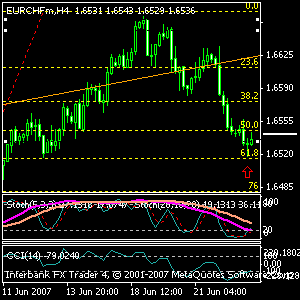
6/25 10:30am EST- This is a EUR/CHF 4hr chart. Price drop lower to the 61.8 fibo and make a stop there. Looking at the chart, a hammer candle is about to form (2nd candle from the right), Stoch and CCI just crossed above buy signal levels. And not to mention the strong 61.8 fibo support. It is also a support level of a long term trendline drawn from March 5 lowest low connect to June 6 lowest low. So there is a 99% good change of a reverse.
This might be a good resersal point. Still no specific TP (target profit) set for this trade, but the original plan of price breaching above friday's highest high is a long term bullish bias is still considered.
I personally not gonna open a position though it's a good entry point, since I still have 9% margin positions opened previously and a long hedge position at the 50 fibo.
Pay attention to the current candle, only 1 hour left before it close. If it closed above/higher than the previous candle close, a hammer candle or inverted pinbar will be confirmed. Go for a long hedge position. Make an independent judgement, trade at your own risk. Use this blog only as a guide, not a recommendation to trade.
6.25 analysis
Posted by
HARWIN
at
10:31 PM
![]()
Subscribe to:
Post Comments (Atom)


0 comments:
Post a Comment